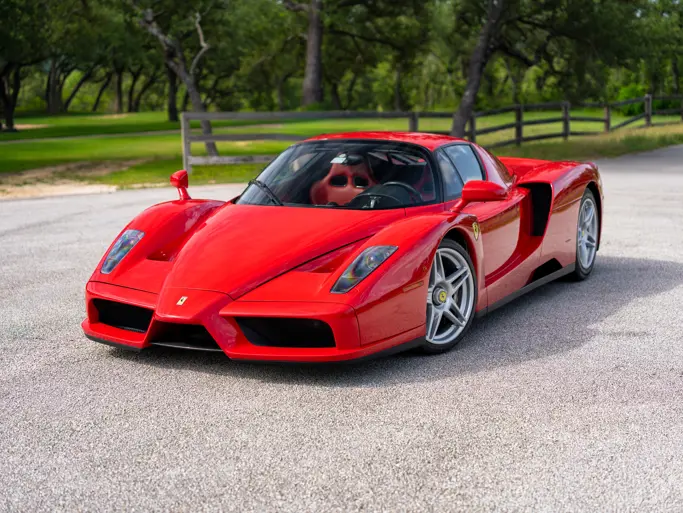
A clip making the rounds this week strings together four numbers that sound less like a car update and more like a market report: a Ferrari Enzo at $17.875M. A 360 Challenge Stradale, a $300K car a few years ago, closing in on seven figures. A GT3 RS that was $365K and is now $500K. An Aventador SVJ that went from $600–800K in January to $1.5M. Every one of those is a real anecdote from a well-informed buyer. None of them, on its own, is "the market." That's the gap between watching one auction result and watching every auction result — so we checked the claims against Motivyn's tracked transaction data, then went looking for what else has been moving the same way.
Checking the Claims
Three of the four hold up. One doesn't, in the way it was framed. And the claim that holds up hardest is also the one already showing the clearest sign of rolling over — a detail no single auction result could tell you, because it only shows up when you watch the full sequence.
Ferrari Enzo — confirmed, and extreme. The data backs the headline number, but the more revealing figure is the sample size behind it: 39 total sold comps exist in our entire tracked history for this model. Roughly 400 Enzos were ever built, and few trade hands in any given year.
| Period | Sales | Avg Price | Range |
|---|---|---|---|
| Jan 2024 | 1 | $4,510,000 | — |
| Aug 2024 | 1 | $2,860,000 | — |
| Jan 2026 | 4 | $14,492,500 | $11.11M–$17.875M |
| May 2026 | 1 | $10,230,000 | — |
| Aug 2026 | 1 | $12,100,000 | — |
A market that moves its "average" 3–5x on the strength of four transactions isn't demonstrating broad new demand. It's demonstrating that two or three serious bidders, at one high-profile sale, set a new anchor — and every subsequent seller is now pricing against that anchor instead of the quieter $2.8–4.5M transactions from eighteen months earlier. That's not organic appreciation. That's a thin market taking its cue from its own headline.
Ferrari 360 Challenge Stradale — confirmed, and already turning. This is the most striking single finding in the dataset. For over a decade, Challenge Stradale prices sat in a stable $90K–$280K band. Then: $226K in July 2025, $603K by September, peaking at $971K in February 2026 — before the three most recent sales came in at $750K, $775K, and $800K. The car nearly quadrupled in seven months, then gave back roughly a fifth of that gain over the next three, before anyone was calling it a bubble. The "approaching $1 million" claim is accurate as a peak description — it's describing the exact top, three months after the fact.
Porsche 911 GT3 RS — doesn't hold up as a market-wide claim. Our aggregate for "911 GT3 RS" — 274 sold comps, the deepest dataset of the four — shows real volatility but no single clean parabolic move the way the Enzo and 360 CS do. Monthly averages bounce between roughly $200K and $450K from 2023 through mid-2026 without a sustained breakout. That bucket almost certainly blends multiple generations — 997.2 GT3 RS 4.0, 991 GT3 RS, 992 GT3 RS — with very different price points. The claim is plausible as a story about one specific, well-optioned car; it isn't a story about the GT3 RS market, because that market, taken as a whole, isn't moving that way.
Lamborghini Aventador SVJ — can't verify. Only 4 recorded comps exist in the tracked dataset, and none since April 2024 — before the move being described. We'd rather flag the gap than manufacture confidence from four data points spread across three years.
It Isn't Four Cars — It's a Category
Checking specific claims is the easy part. We scanned every tracked model with at least three recorded sales in the last four months and at least three in the eight months before that, ranked by how much the average moved.
| Model | Sample | Prior Avg | Recent Avg | Change |
|---|---|---|---|---|
| Mercedes-Benz SLS AMG | 13/23 | $222K | $479K | +116% |
| Porsche 911 (broad) | 21/54 | $245K | $501K | +104% |
| Ferrari 360 Spider 6-Speed | 5/6 | $137K | $267K | +95% |
| Shelby Cobra | 4/8 | $104K | $199K | +91% |
| Ferrari 458 Italia | 9/12 | $192K | $340K | +77% |
| Porsche 911 Turbo | 11/100 | $169K | $294K | +75% |
| Ferrari 488 Spider | 7/7 | $247K | $417K | +69% |
| Ferrari 599 GTB Fiorano | 9/7 | $167K | $251K | +51% |
| Ferrari F355 Spider 6-Speed | 15/7 | $130K | $194K | +49% |
| Ferrari 812 Superfast | 5/4 | $359K | $520K | +45% |
| Acura NSX | 8/19 | $87K | $124K | +42% |
| Toyota Land Cruiser FZJ80 | 8/3 | $55K | $76K | +39% |
| BMW M5 6-Speed | 5/3 | $51K | $71K | +39% |
Seven different Ferrari eras — 360, 458, 488, 599, 812, F355 — moving together. Multiple Porsche generations. And names with nothing to do with Italian supercars at all: a Mercedes SLS, a Shelby Cobra, an ordinary Land Cruiser, a BMW M5. Twenty-five unrelated cars, a dozen manufacturers, five different decades, don't independently discover they're each 40–100% undervalued in the same four-month window. That's not twenty-five stories. It's one story, wearing twenty-five name tags.
*A caveat worth stating plainly: several of these run on thin samples, some model buckets blend sub-variants the same way the GT3 RS bucket does, and a rising average partly reflects which specific examples happened to sell recently, not pure like-for-like appreciation. Treat this as a strong directional signal, not a laboratory result.*
Why Moves Like This Correct
This exact pattern — broad, simultaneous, unrelated-asset appreciation over a short window — has a documented history in the collector car market, and it has never once been permanent.
1988–1991: Japanese asset-bubble capital, chasing yield during an era of extraordinarily cheap credit, poured into exotic cars. F40s and 288 GTOs ran up 300–500%+ in about two years. When Japan's domestic bubble burst and global rates rose in 1990–91, those same cars lost 60–80% of peak value within eighteen months. Some didn't recover for over a decade.
2012–2015: A wave of new buyers, pulled in partly by media attention and a documentary, plus cheap post-financial-crisis capital, drove air-cooled 911s up 3–4x in three years. 2016–2017 brought a real, well-documented 20–30% correction as the speculative buyers who piled in during 2014–15 tried to sell into a market that had stopped adding new buyers at the same pace.
2020–2022: COVID stimulus and near-zero rates inflated nearly every collectible simultaneously — cars, watches, sneakers, cards, wine, art. That simultaneity is itself the tell: unrelated asset classes appreciating on the same timeline points to a shared external driver, not anything intrinsic to any one of them. Most of those other categories have already round-tripped a meaningful share of those gains. The top end of the car market, arguably, lagged behind — which may be part of why it's catching up hard now.
The mechanism, plainly: a headline result isn't the market, it's the top of it — a single record sale reflects two people who wanted one specific car badly enough to bid it there, and gets reported as "the market" anyway. Auction houses earn a percentage on both sides of every sale, so a widely-reported record benefits their business regardless of whether it represents where the next ten transactions land. And when a car doubles in six months, a meaningful share of the people who bought it did so to resell, not to keep — that supply shows up a few months later, right as the pool of new speculative buyers is thinning, which is very likely what the 360 Challenge Stradale's last three sales are already showing.
What to Actually Watch
The discipline isn't calling the exact top — nobody reliably does that, in any asset class. It's recognizing the unwind early enough to act, without confusing "this car already gave back 20% from an absurd peak" with "therefore it's cheap."
This is analysis, not certainty — illiquid, sentiment-driven markets can stay irrational longer than any model expects, and timing is always harder than direction. What the data supports is narrower and more useful than "buy the dip on an Enzo": a broad, simultaneous, thin-market rally with at least one component already showing the first real crack, and a documented history of similar rallies correcting 20–80% once the buyers who drove the run-up need to become sellers.
*This analysis covers 22,627 sold comps from Motivyn's tracked transaction database (189K+ listings overall). Model-level averages are simple period means of recorded sold prices, not adjusted for condition or options unless noted. Several model buckets blend closely related sub-variants, flagged inline where material. This is market analysis, not investment advice.*